Bloomberg Center for Government Excellence
City Data Explorer
The City Data Explorer is an interactive platform developed at the Bloomberg Center for Government Excellence. It empowers city leaders, policymakers, and the public to explore complex urban datasets through accessible, responsive visualizations. The City Data Explorer brings together information from 25 distinct data sources into a single, unified platform. By aggregating these datasets, the tool enables users to compare, contextualize, and analyze city data holistically—eliminating silos and making complex information more accessible for decision-making.

-
As a Data Visualization Designer, I collaborated closely with data scientists, researchers, and developers. My responsibilities included:
Designing responsive, intuitive data visualizations.
Contributing to UI/UX design for data navigation and interaction.
Ensuring accessibility and usability across devices.
-
Our challenge was to create a tool that made complex data understandable, actionable, and visually engaging, while maintaining data accuracy and transparency.
-
I approached the project with a focus on clarity, responsiveness, and accessibility:
Clarity: Each chart was designed to highlight meaningful insights without overwhelming users.
Responsiveness: Visualizations dynamically adapted to desktop, tablet, and mobile devices.
Accessibility: Color palettes and interaction states were tested to ensure inclusive use.
-
I designed a series of responsive charts, including:
Interactive bar and line charts for trend analysis.
Choropleth maps for geographic insights.
Trend charts that clarified how our data model and determinations were made.
-
The City Data Explorer enabled city leaders to quickly identify patterns, share insights with the public, and make evidence-based decisions. By simplifying complex datasets, the platform improved civic transparency and strengthened data-driven governance.
-
This project deepened my expertise in designing responsive, accessible data visualizations and reinforced the importance of bridging technical complexity with intuitive design. It also sharpened my UI/UX collaboration skills—ensuring data products are not only functional but also engaging and human-centered.
-
![]()
Customized City Pages
Using meticulously modular design, backed by a profoundly developed database, each of the 100+ cities in the explorer has a custom metrics page.
-
![]()
User-centered Design
User-centered design means grounding decisions in real experience. Through structured user testing and iterative feedback, I refined the interface to ensure clarity, accessibility, and responsiveness. Each round of insights informed design adjustments that made the tool more effective and intuitive for its intended audience.
-
![]()
Intuitive Design for Complex Hierarchies
As a team, we emphasized the importance of defining data and its limitations. By iterating and testing the information design, we displayed high level information, definitions and limitations, as well as extremely detailed data models for users.
-
![]()
Novel Trend Data Visualization
In collaboration with data scientists and developers, I designed graphics that communicate the trend deduction to improving or declining, rapidly or slowly.


-
![]()
Progressive Comparison Pages
Building on visuals from individual city pages, comparison pages for all cities and two cities were designed to offer various options for city analysts and officials to see their data.
-
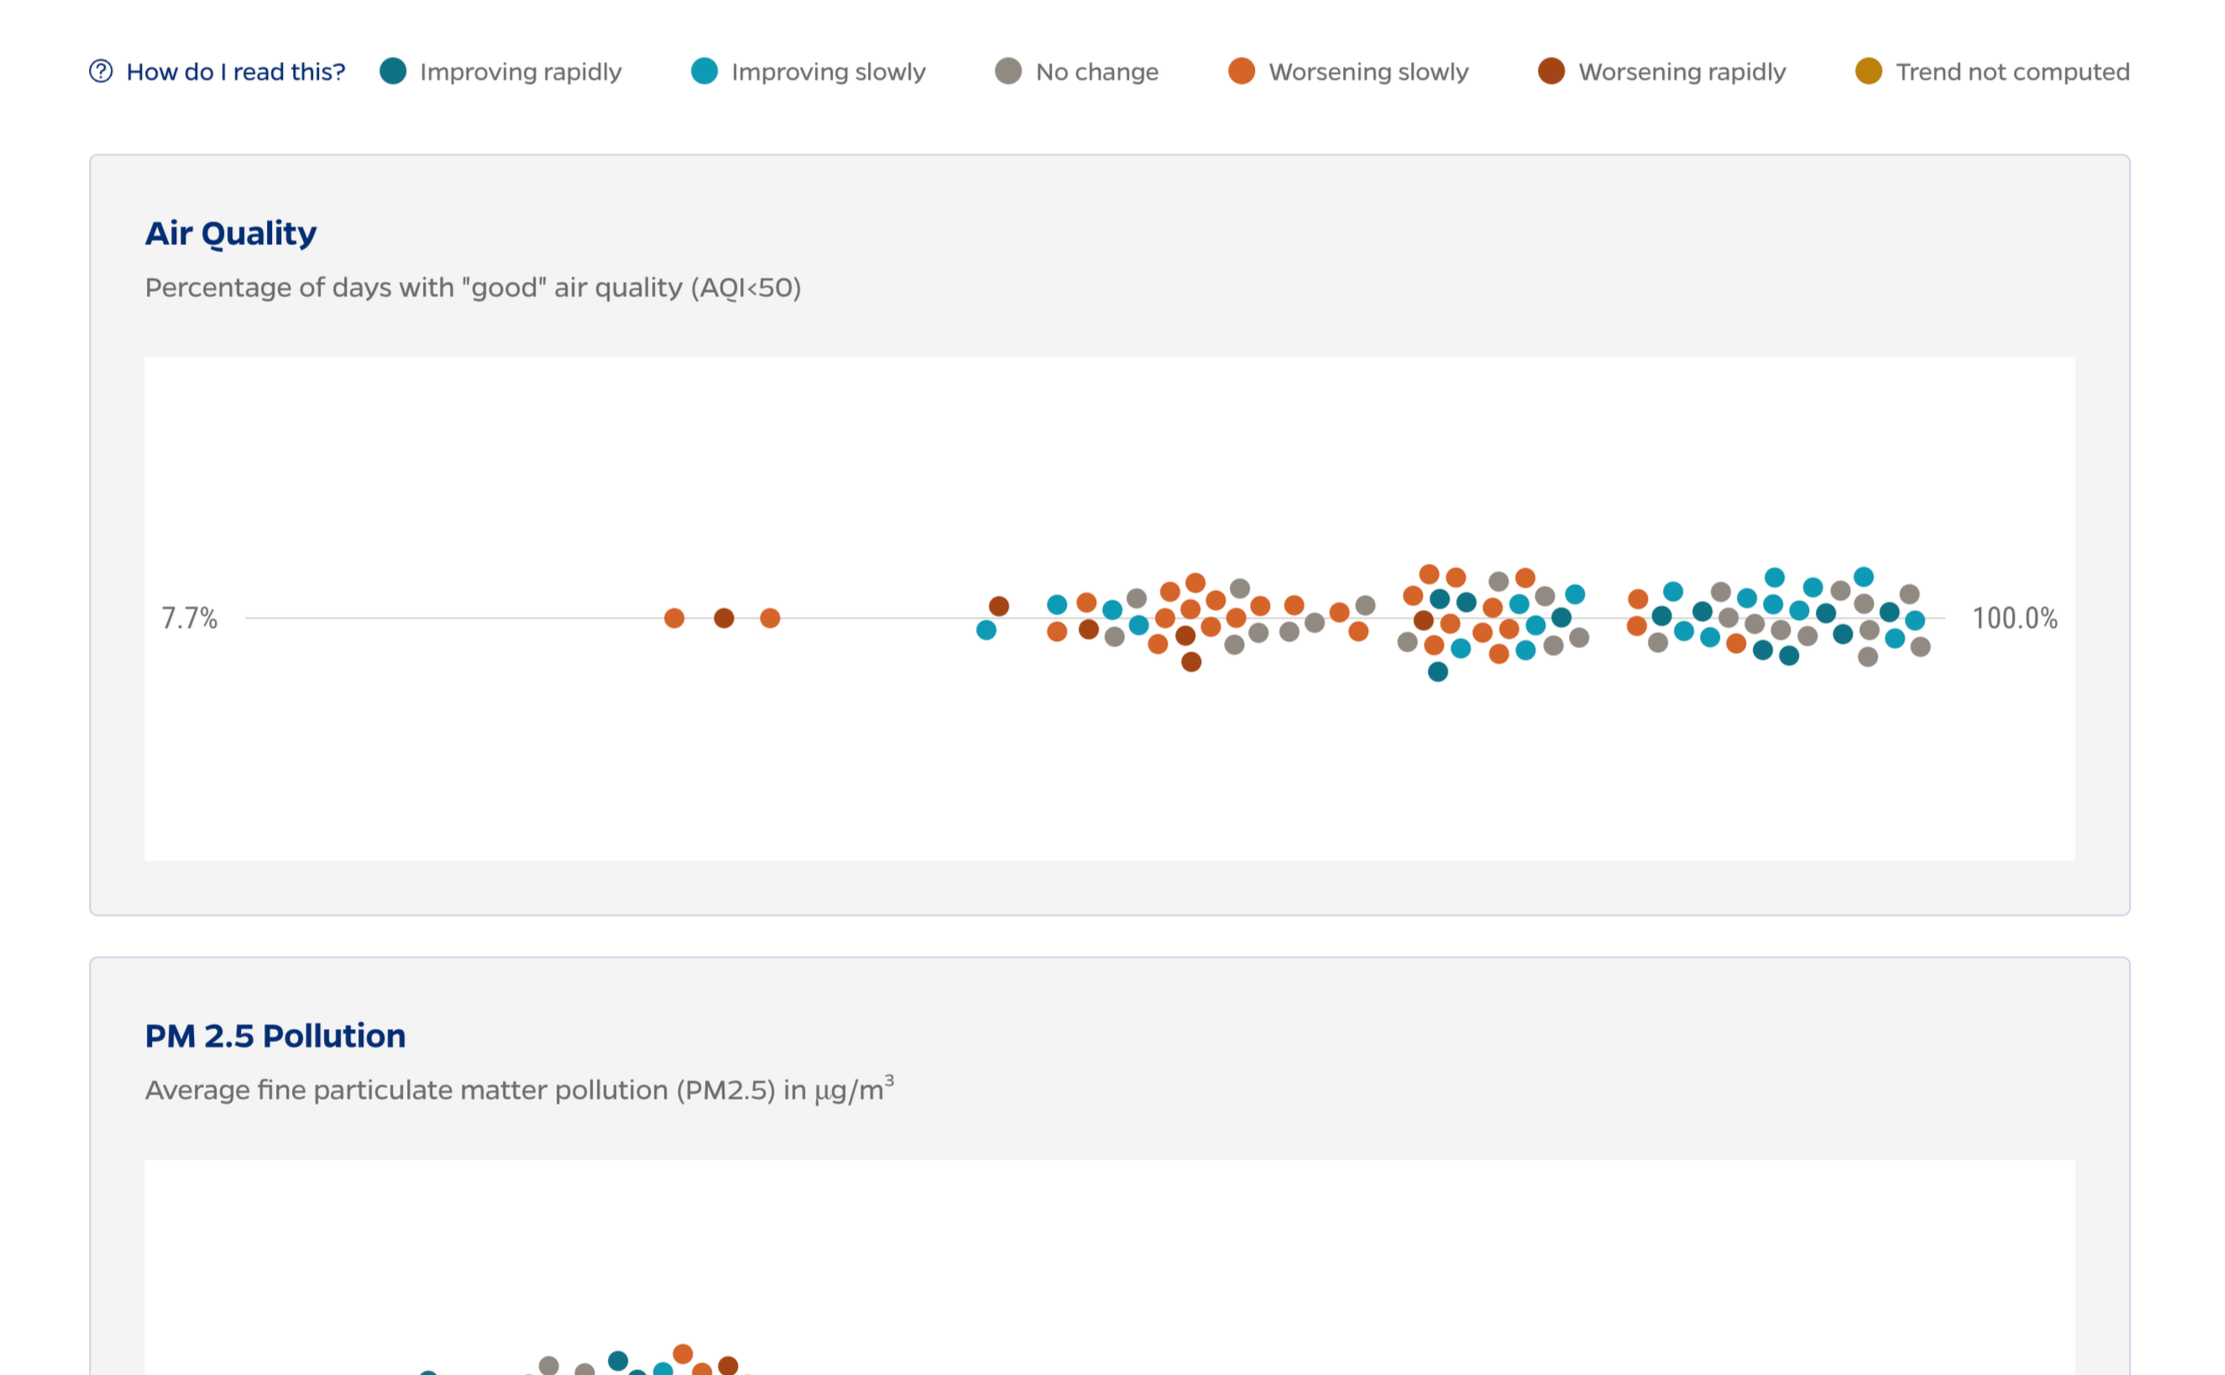
![]()
Highlighting Individual Cities
The visualizations allow users to highlight a single city within national comparisons, making it easy to see local performance in the context of all cities.
-
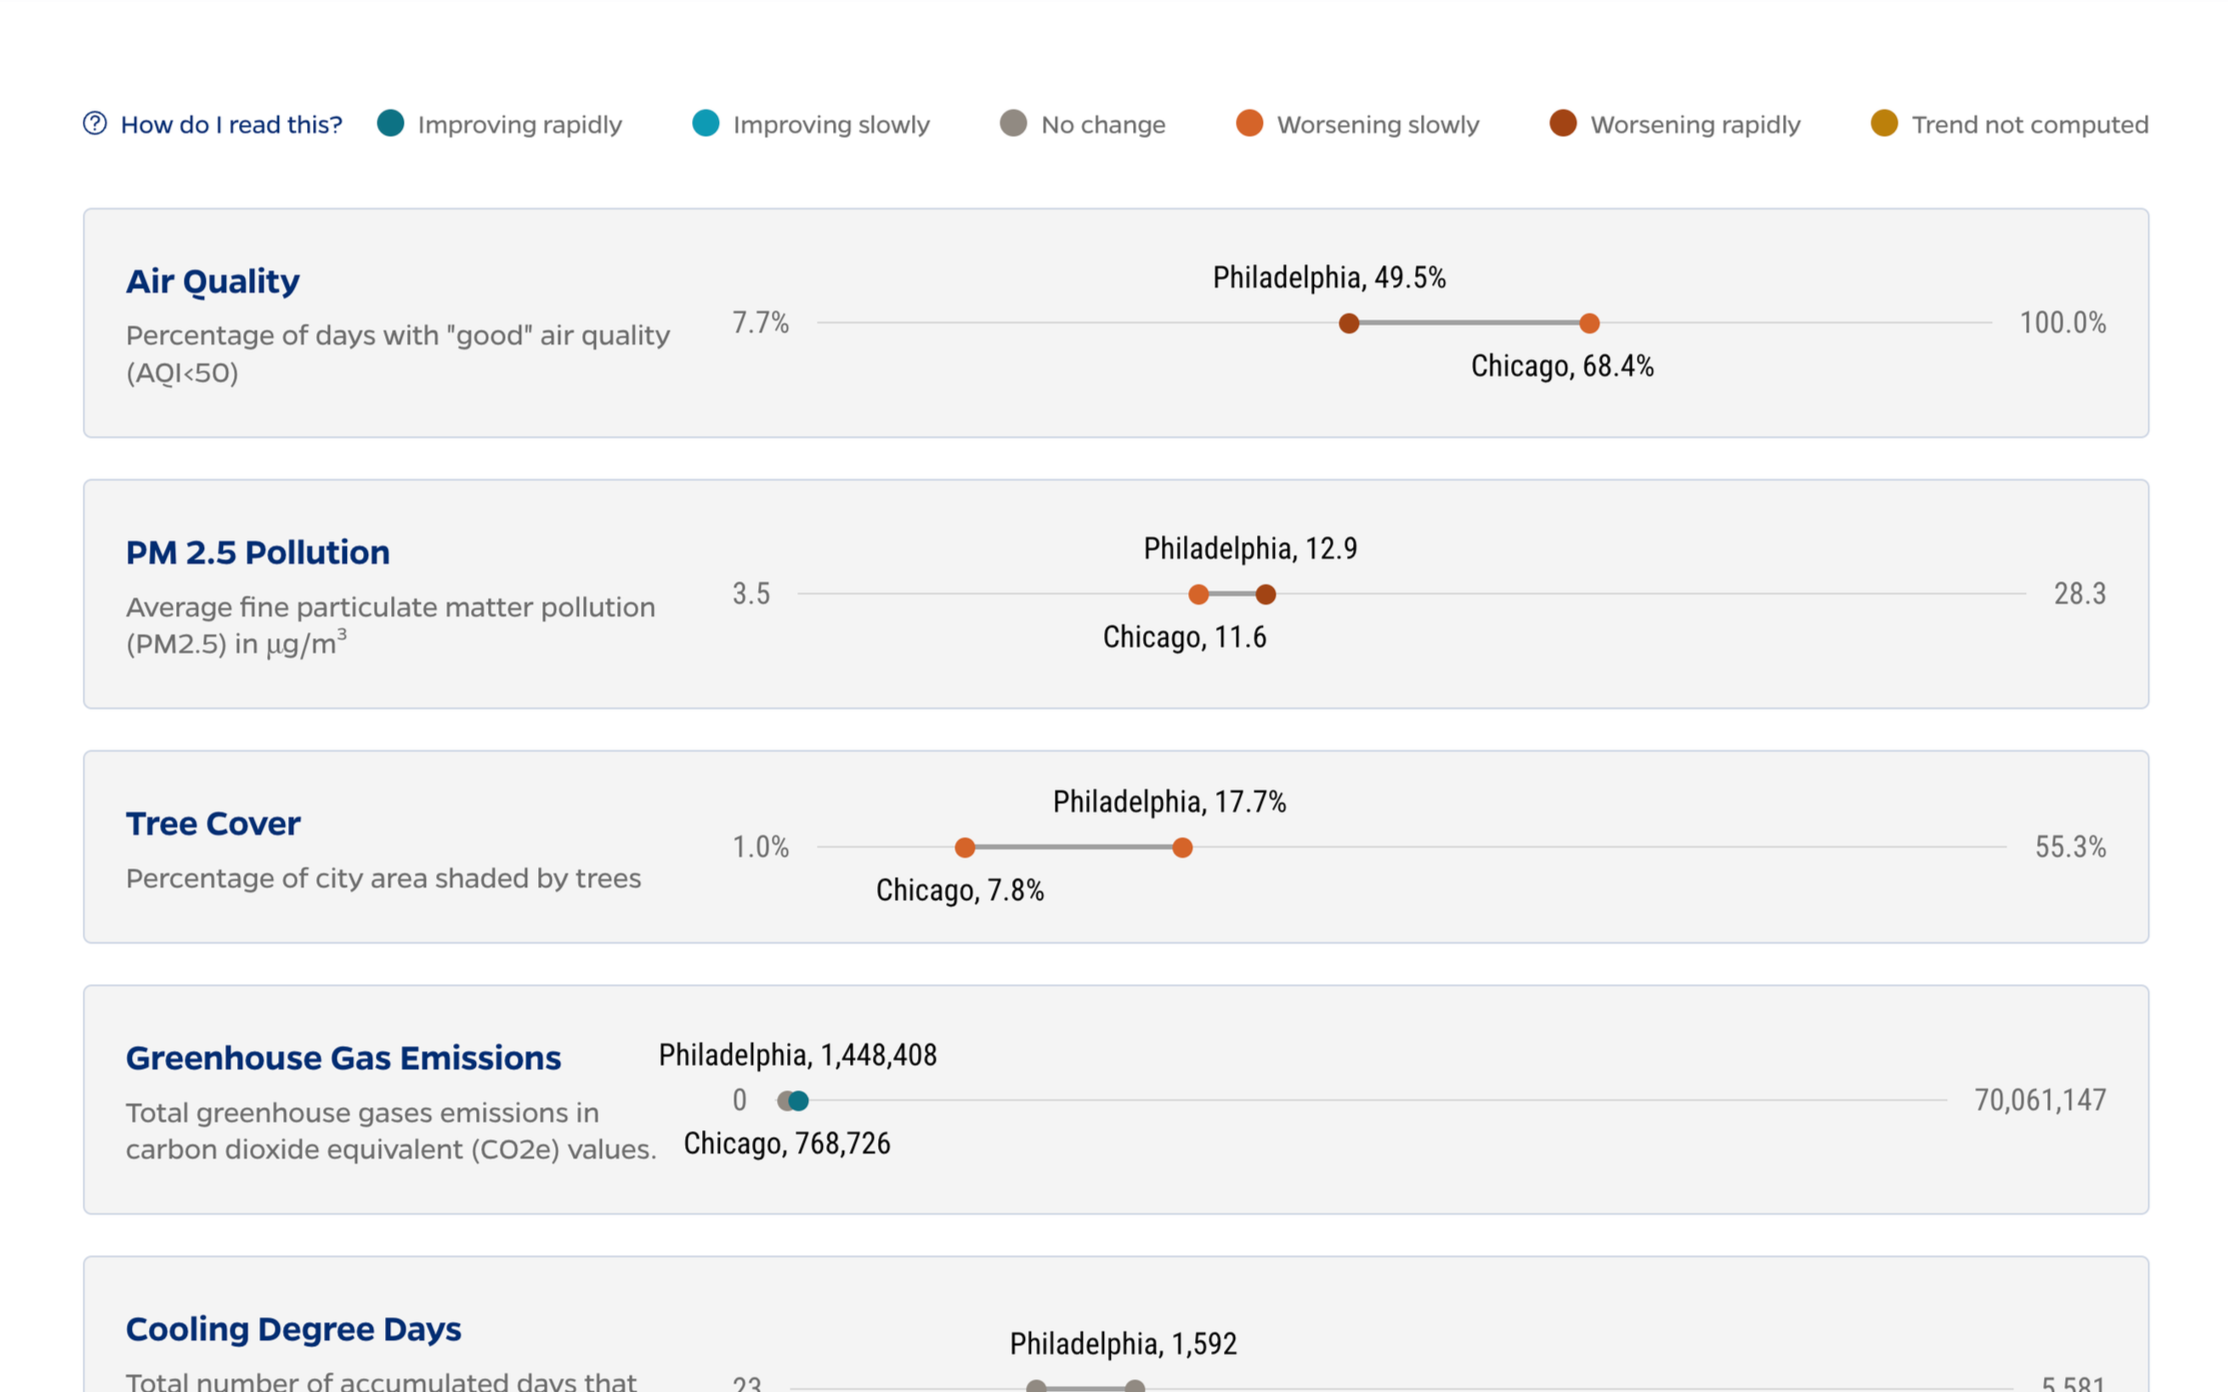
![]()
Two-City Comparison
The tool enables side-by-side comparisons of two cities, allowing users to quickly identify similarities, differences, and relative performance across key measures.
-
![]()
Insightful Trend Analysis
Trend analysis features allow users to examine changes over time, making it possible to identify patterns, track progress, and surface long-term insights from city data.